
Stem & leaf plots are conventionally used for numerical values. Below is a simple interactive prototype for a verbal stem and leaf plot showing the as-of-now 107 accepted 2-letter words in Scrabble.
What is a Stem & Leaf Plot?
From Wikipedia: A stem-and-leaf display or stem-and-leaf plot is a device for presenting quantitative data in a graphical format, similar to a histogram, to assist in visualizing the shape of a distribution. They evolved from Arthur Bowley's work in the early 1900s, and are useful tools in exploratory data and analysis. Stemplots became more commonly used in the 1980s after the publication of John Tukey's book on exploratory data analysis in 1977.[1] The popularity during those years is attributable to their use of monospaced (typewriter) typestyles that allowed computer technology of the time to easily produce the graphics. Modern computers' superior graphic capabilities have meant these techniques are less often used.
Why use a Stem & Leaf Plot?
A Stem & Leaf plot allow you to visualize, at-a-glance, fine-grained information not available in a histogram or box plot. The graph below, for example, does communicate how many two-letter Scrabble words start with “A”, but it does not tell you what those words are:

View the source (click this if your browser plugins block this embedding).
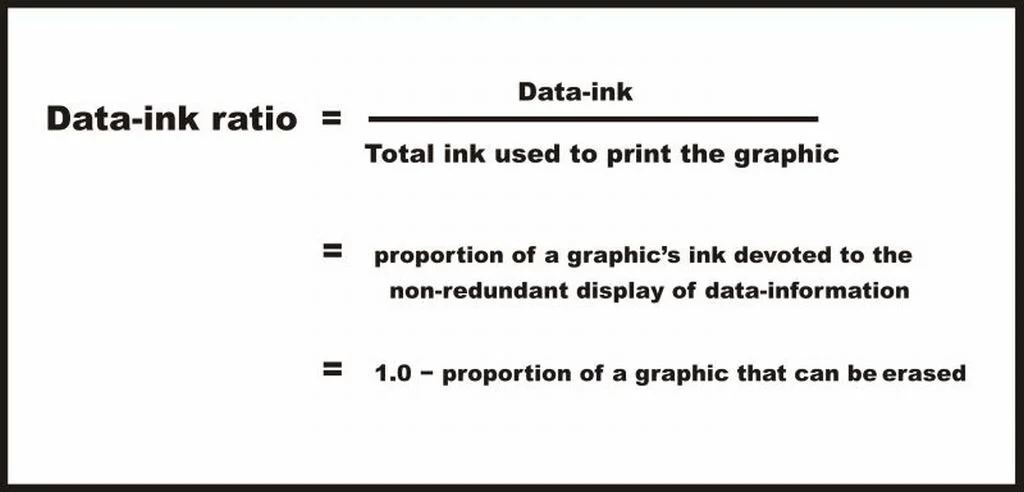
https://infovis-wiki.net/wiki/Data-Ink_Ratio
By replacing these dots with “leaves” — in this case, the second letter of Scrabble words — the reader can glean more information without meaningfully decreasing Tufte’s data-ink ratio.
For those interested, Cmglee has provided an interesting matrix visualization depicting the history of Scrabble’s two-letter words, shown below.

https://en.wiktionary.org/wiki/Appendix:Official_English_Scrabble_2-letter_words#/media/File:Collins_Scrabble_Words_2_letters_history.svg